
- calendar_month May 28, 2024
- folder Commercial Real Estate
Sharing Tags
Commercial Market Update, CRE, Current Real Estate, Industrial, Industry, multi-family, Office Buildings, Real Estate Investment, Real Estate News, Retail
This blog by The Crexi Team talks about what happened with commercial properties listed on Crexi in April 2024. They looked at things like how much each square foot costs, what people were searching for, how many spaces were being used, and other important stats. The goal is to give you, the property owners, renters, and future investors useful information so together we can make smart and informed decisions about commercial real estate.
The Crexi Team | May 13, 2024
Welcome to the April 2024 release of our Crexi Trends report. We analyze Crexi's database each month to identify relevant activity and patterns and share key insights with our users.
Our report showcases trends across Crexi's commercial property listings in March, evaluating average price per square foot, search behavior, occupancy, and other noteworthy metrics. With this information, we aim to arm principals, tenants, and brokers alike with actionable learnings to make well-informed commercial real estate decisions.
Overall National Sales Trends
What the Data Says
- On the sales side of Crexi, the average asking price per square foot was down 1.65% for new listings compared to March numbers.
- This decline was paired with a slight decrease in occupancy averages (77.98% down almost 1%) and fewer unpriced listings, as sellers are more honest about pricing in an effort to up transaction speed.
Asset Type Trends
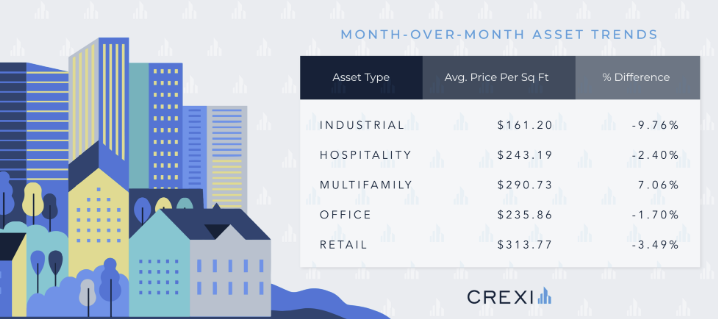
- Industrial assets for sale signaled the most change in April, with new listings asking nearly 10% less per square foot in value compared to the previous month. This was due to a sharp decrease in occupancy of new assets, hitting an average of 63% compared to 69% for new listings in March 2024.
- Conversely, multifamily performed well last month, with a noticeable 7% climb in average asking prices for new listings and nearly 83% occupancy holding strong in both March and April.
- Office, retail, and hospitality all posted relatively small asking price changes for new listings in April; office and retail showed some slight dips in occupancy, down 2% and 1% compared to March, respectively.
Key Takeaways
- The observed decrease in unpriced listings is a trend we often observe with pricing falls, as sellers become more upfront about their perceived value and seek to speed up a sale with faster negotiation timelines. In the same period, we observed searches for properties rise 7.7%, which could indicate that more liquidity is ready to come to market for the right deal, especially as the seller-bid ask gap starts shrinking.
- As we mentioned with unpriced deals above, we saw a noticeable jump in unpriced multifamily listings in April, hitting 12.25% of total new listings compared to less than 10% in March. As the asset class continues performing well amid macroeconomic challenges, new sellers became more confident in their valuations with less pressure to sell at a fast discount.
- While retail showed slight corrections, the sector’s pricing is still significantly valued higher than April 2023, with asking prices up over 17% year-over-year, and remains a desirable and reliable asset amid other volatile options.
Overall National Leasing Trends
What the Data Says
- Average leasing rates continued their gentle downward trajectory, with asking rents down 2.74% overall for the market in April.
Asset Type Trends
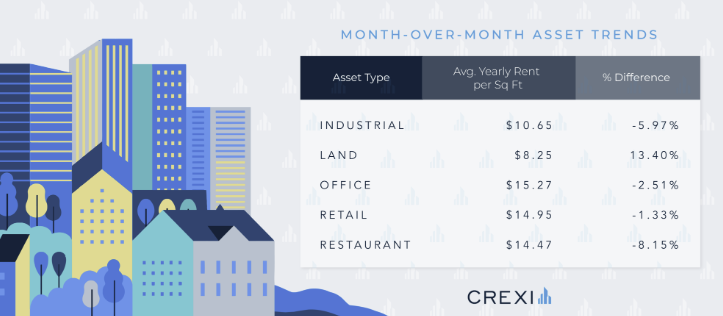
- Restaurants showed the most rent movement in April, with average annual asking rates lowering over 8% from the previous month.
- Offices had a second consecutive month of leasing dips, down 2.5% last month compared to March rates. However, this was most likely driven by more Class B and C assets coming online following a few months of Class A availability.
Key Takeaways
- Restaurants’ shifting lease rates come amid California’s new minimum wage law for fast-food workers that took effect April 1st and a slew of other rising costs impacting restaurant tenants. We’ve yet to observe the long-tail impact of these regulatory factors, but tenants will need to be more careful with their budgets to maintain operations, which could drive them to seek more affordable lease options.
- As the availability of high-end office space dries up, tenants still looking for Class A amenities and locations may find what they need in upgraded Class B office units, providing opportunities for owners to capitalize on this. Indeed, “offices for rent” searches remained steady on Crexi in April as the second most-searched rentals by type on our platform (behind only retail).
Regional Breakdown
What the Data Says
- Houston, Chicago, and Miami took the top three spots as Crexi’s most popular cities for property investing in April. In the same period, Miami searches in particular rose by 14.8%, with San Antonio also boasting a 15% gain in active property seekers’ attention.
- On the leasing side, Houston, Chicago, and Los Angeles were the most active cities in terms of attracting tenant attention in April. Houston saw tenant searches rise 9.4%, while Miami’s tenant searches jumped an impressive 20.2% from March activity.
Highest Asking Price by MSA — April 2024
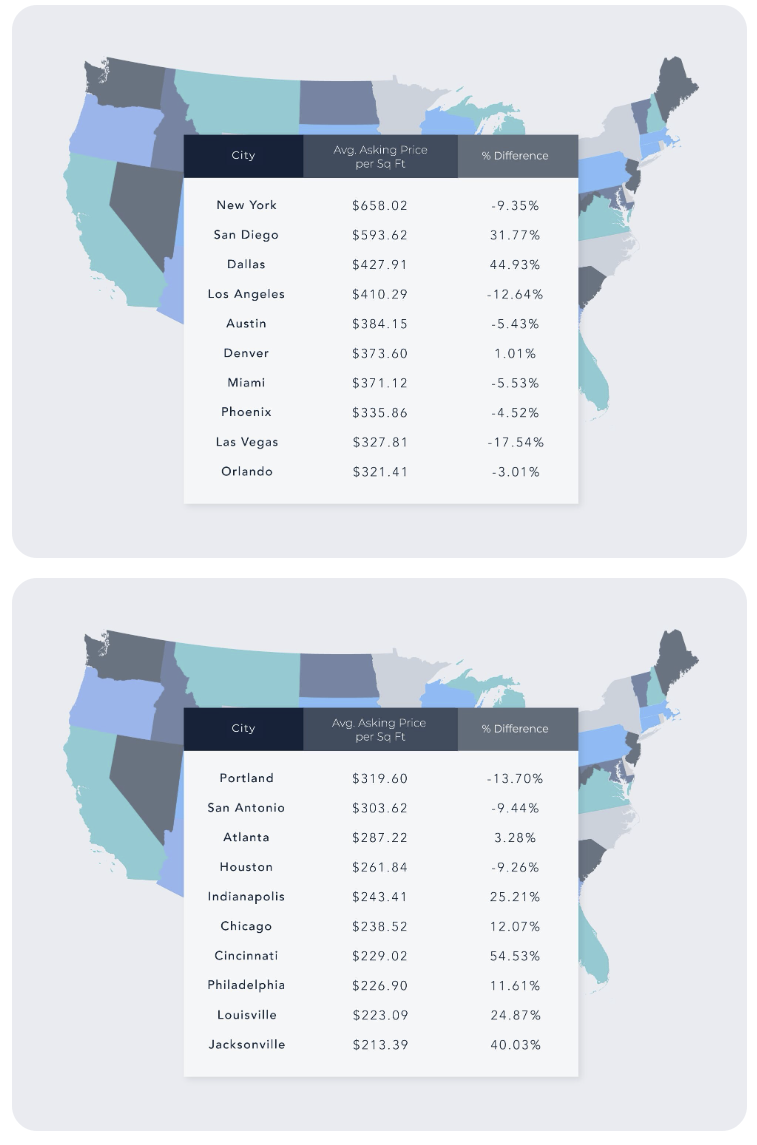
Disclaimer: This article's information is based on Crexi's internal marketplace data and additional external sources. While asking price in many ways reflects market conditions, variations in pricing are affected by changes in inventory, asset size, etc. Nothing contained on this website is intended to be construed as investing advice. Any reference to an investment's past or potential performance should not be construed as a recommendation or guarantee towards a specific outcome.
